
Research report · PDF + CSV
City market report
A €49 one-off PDF + CSV that shows 180 nights of measured asking prices for one city — 30 exhibits, built from about 2,800 places read every night in the Gdańsk example, with no modelled numbers.
- 30 exhibits
- 180 nights
- 5 sections
- 0 modelled numbers
Secure card payment by Stripe · emailed within 2 hours, checked by hand
What's inside
What is in a short-term rental market report?
A short-term rental market report shows what places in one city ask per night, how that price moves through the year, and how much is on sale. Ours covers one city for the 180 nights from the day it is made, in 30 exhibits grouped into five sections: price, time, supply, product and an investor frame.
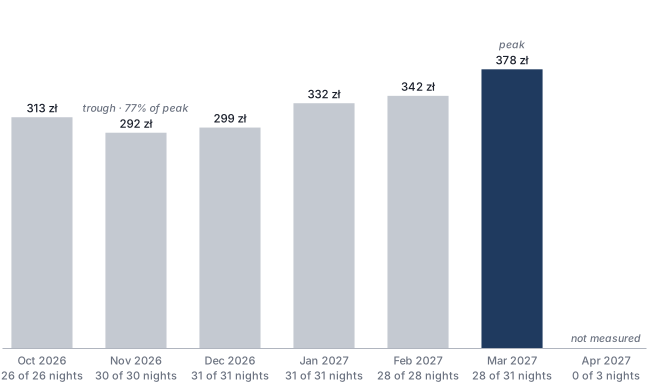
Each exhibit is titled by its finding rather than its chart type — “March peaks at 378 zł”, not “Monthly median” — and carries its own source line: how many places, how many nights, when the prices were read. An exhibit the data cannot support is left out and listed with the reason, so a thin town gets a shorter report, not a padded one. Around the exhibits sit a cover with the key figures, the year in one table, a sources and definitions page, and a CSV with one row per night for your own spreadsheet.
Price 11
What a night costs, and how it splits.
- The typical night and the middle-half price band, night by night
- How many places ask each price
- Price by property type
- Price by star rating
- Price by district
- Price map of every pinned place
- Price against distance from the centre
- Price against guest score
- Share of places at the upper end
- Entry level: what the cheapest quarter asks
- Spread between the dear and the cheap end
Time 7
How the price moves through the 180 nights.
- Month by month, with peak and trough
- Weekday pattern and the weekend premium
- Calendar of every night, coloured by price
- Holiday and event nights against usual nights
- Lead time: the same night read on two days
- Weekend premium by property type
- The hotel channel against the home-rental channel
Supply 6
How much is on sale, and where.
- Places open each night
- Homes against hotels
- Supply by district
- Price gap between homes and hotels
- Sold-out share on event nights
- Sold-out share by district
Product 5
What places offer, and what it is worth.
- Amenity coverage across the town
- Observed price premium per amenity
- Bedroom mix of homes
- Guest score distribution
- Star rating mix
Investor 1
A gross-revenue frame, not a forecast.
- Your occupancy assumption × our measured median, month by month
Extras
Around the exhibits.
- Cover with the key figures and a method box
- The year in one table: every month's median, average and middle half
- Sources, definitions, and what was left out and why
- CSV data pack: one row per night, ready for a spreadsheet
Four exhibits from the Gdańsk sample
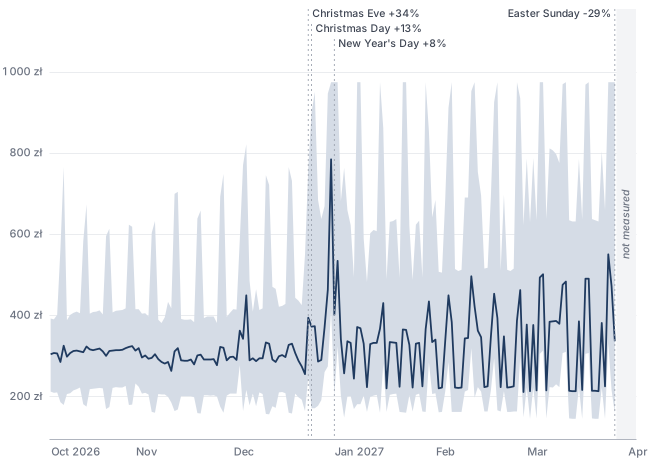
- Median night
- Middle half of places
- Event night
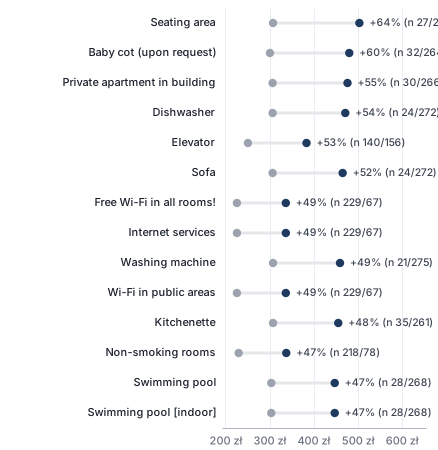
- Median, places with it
- Median, places without it
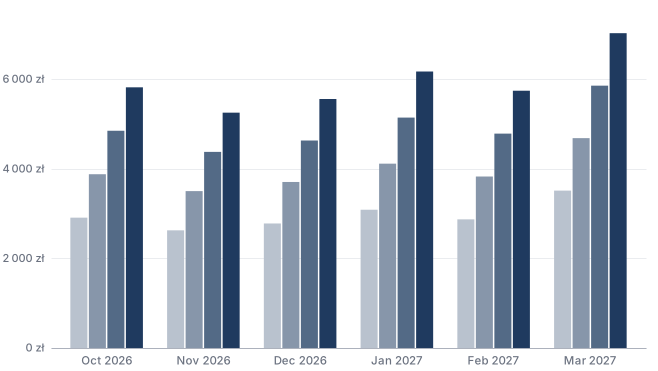
- 30%
- 40%
- 50%
- 60% occupancy
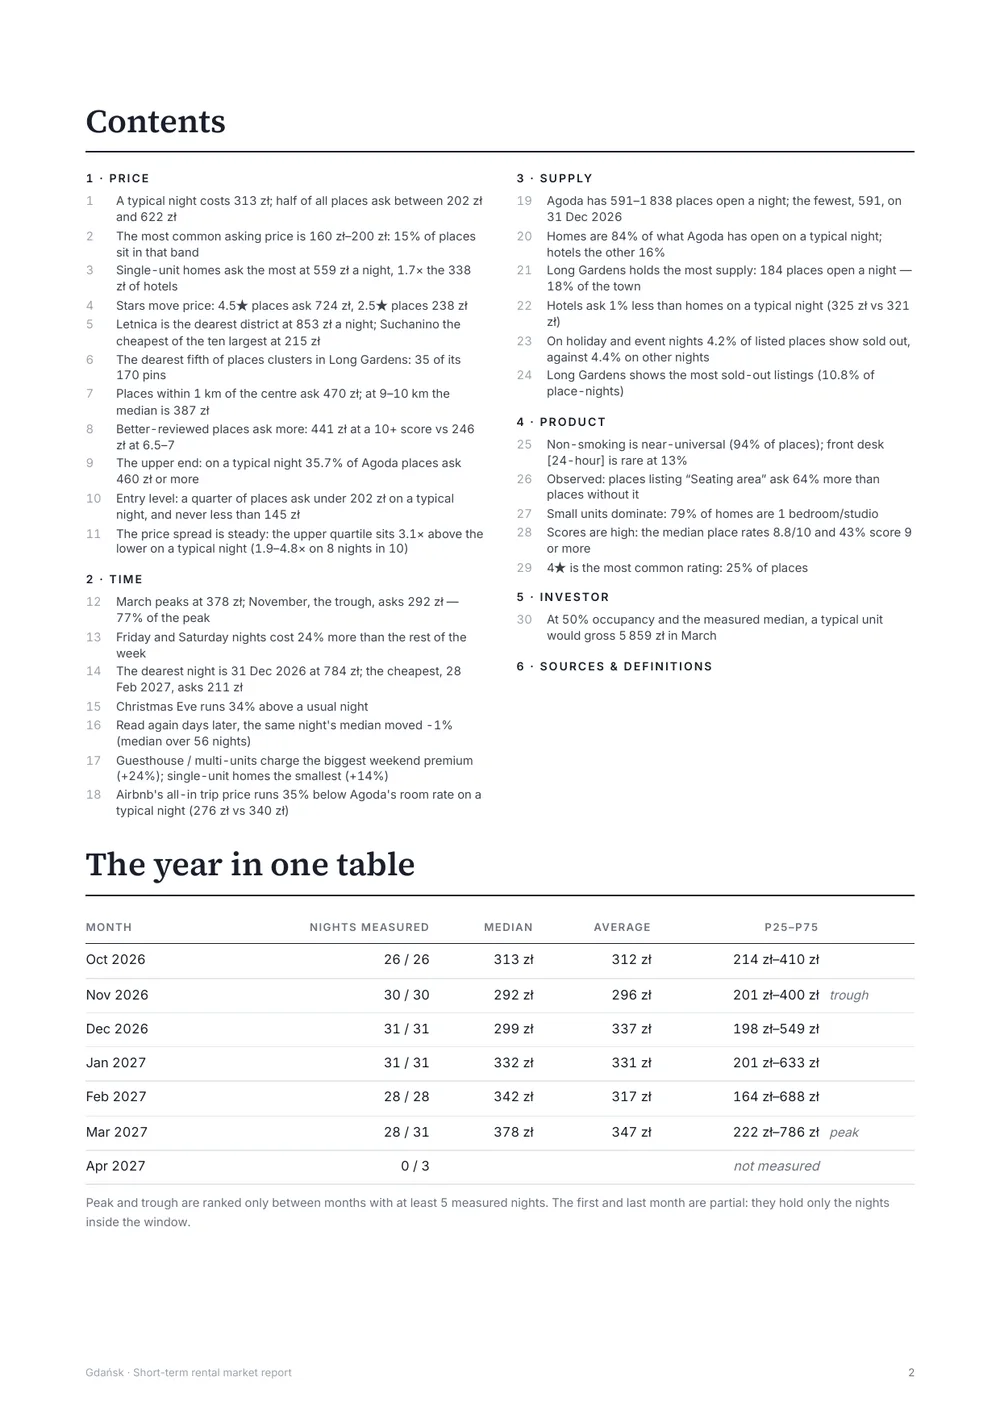
A page from the sample
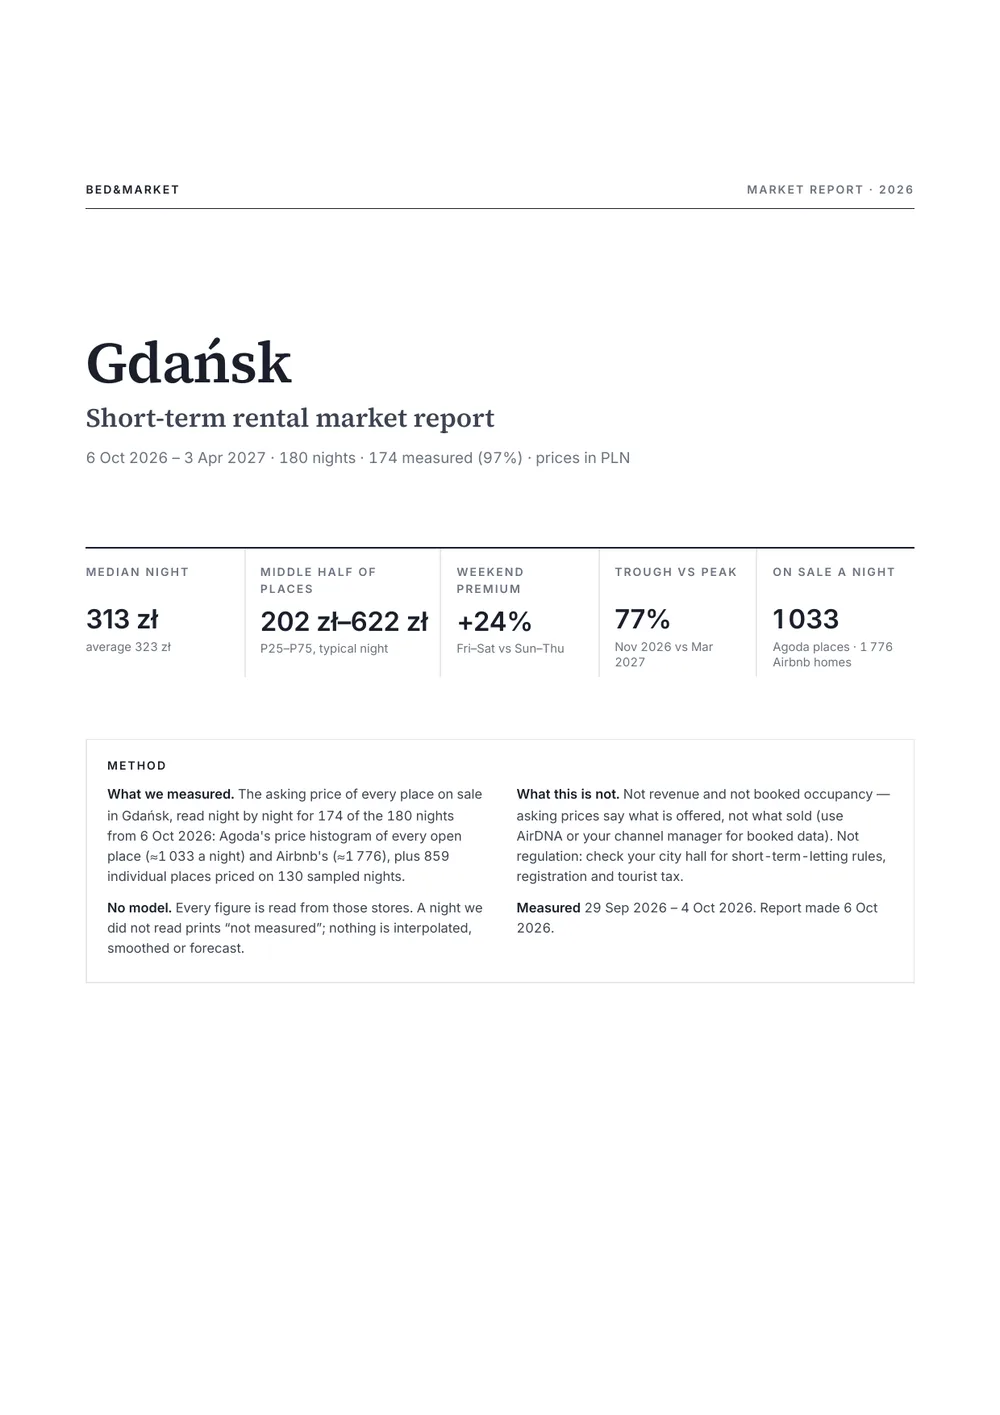
The contents page reads as a summary: every exhibit's finding in one line, then the year in one table — each month's median, average and middle half, with peak and trough marked.
Method
How is the data measured?
The data is measured by reading the public asking price of every place on sale in the city, night by night, for the 180 nights ahead. We read two kinds of listing — hotel-type properties and private homes — because a town's price is set by both. Every number in the report is a median, a quartile or a count of those readings. Nothing is interpolated, smoothed or forecast, and a night we could not read prints as “not measured” instead of being filled in.
To cut prices by property type, district and amenity, we also follow a sample of places one by one. The exhibits that use the sample say so, and print how many places it holds.
Example: Gdańsk report, measured 6 Oct 2026
- 313 zł median asking price for a night
- 202–622 zł middle half of all places
- 1,033 hotel-type places and 1,776 homes on sale a night
- 174 of 180 nights measured
- 859 places followed one by one
Source: Bed&Market readings for Gdańsk.
What it is not
- Revenue or booked occupancy — asking prices show what is offered, not what sold
- A forecast — nothing is modelled, interpolated or smoothed
- Regulation advice — check your city hall for short-term-letting rules and tourist tax
Measured vs modelled
Measured vs modelled: how is this different from revenue estimates?
Measured data is the price a place is asking today; a modelled estimate is a number a tool infers from patterns. Many short-term rental analytics tools sell revenue and occupancy estimates: they watch some calendars, guess which blocked nights were booked rather than closed by the owner, and model what a listing probably earned. Those figures can be useful, but nobody outside the tool can check them, and two subscription dashboards often disagree about the same street.
This report takes the other side of the trade. It prints only what can be read: the price each place asks for each night, and how many places are open. You give up an earned-revenue figure; you get numbers you can re-check yourself on any listing site tonight. The one exhibit where an assumption enters is the investor frame, and the assumption is yours — you pick the occupancy rate, we multiply it by the measured median, and the page says so.
| Question | This report: measured asking prices | Typical modelled revenue tools |
|---|---|---|
| Data source | Public asking prices, read for every place on sale, every night | Calendars of a subset of listings, turned into guesses about which nights sold |
| Updated | Read fresh when your report is made; each exhibit prints its read dates | Refreshed on the tool's schedule, often monthly |
| What is estimated | Nothing. Unread nights print as “not measured” | Occupancy, booked nights and revenue |
| Sample shown | Every exhibit states its places and nights | Varies; often not stated per figure |
| Can you check a number? | Yes — open any listing site and look at tonight's price | No — a modelled figure has nothing to compare against |
| Price model | €49 one-off, files yours to keep | Monthly subscription |
Coverage
Which cities are covered?
Any city or town with places on sale can be covered: you choose it before you pay, and the report is built for it from fresh readings. The report works best where a few hundred places are on sale on a typical night. A large city such as Gdańsk or Kraków fills every exhibit; a small seaside town may lose the district and amenity cuts, and those pages are left out with the reason rather than padded.
Every report is read by a person before it goes out. If your town has too little data to say anything useful, we tell you and refund the full €49. Prices print in the local currency of the listings — złoty for Polish cities, euro in the eurozone — and you pay in euro either way.
To see the kind of numbers we measure before you buy, our free market pages show the town-level picture for 137 places, among them:
Delivery
How is the report delivered?
The report is delivered by email as a PDF and a CSV within 2 hours of payment, after a person has read every page. You choose a city and pay €49 once by card. The report is built from fresh readings for that city, then checked by hand: if a number looks wrong or the town is too thin to support an exhibit, it is fixed or left out before anything is sent.
Download links arrive at the email you paid with and work for 30 days; the files are yours to keep. The Gdańsk sample runs to 24 A4 pages. There is no subscription and nothing renews.
- 1
Pay
Choose your city and pay €49 by card through Stripe.
- 2
We prepare and check it
The report is built from our measurements, then a person reads every page before it goes out.
- 3
In your inbox
PDF and CSV links arrive at the email you paid with, within 2 hours. They work for 30 days.
Readers
Who is it for?
The report is for anyone who sets or judges nightly prices in one city and wants measured numbers instead of estimates. It answers the questions that come before a price change or a purchase: what a typical night costs, which months and weekdays carry a premium, how much is on sale, and what an amenity is worth in asking price. It is written for three kinds of reader.
Hosts and guesthouse owners
Set a base price and a weekend premium against what the town actually asks, by type and district, and see where the cheapest quarter sits.
Property managers
Bring a printed, sourced view of the town to a new owner, and a CSV to plan the season's rates from.
Investors and lenders
Frame gross revenue from a measured median and your own occupancy assumption — every input visible, nothing modelled behind it.
It is not for anyone who needs booked occupancy or earned revenue for a single listing: asking prices show what is offered, not what sold, and we would rather say so here than after you pay.
Questions
Before you buy
Which cities can I buy?
Any town you can find in the picker. The report works best where a few hundred places are on sale. Every report is checked by hand before it is sent, and if your town has too little data to say anything useful, we tell you and refund you in full.
What currency are the prices in?
The local currency the listings show for that country — złoty for Polish cities, euro in the eurozone, and so on. You pay €49 either way.
What if my city has too little data?
You get your money back. We would rather refund than send a thin report: nights we could not measure print as “not measured”, and exhibits the data cannot support are left out with the reason.
What format is it?
A PDF (the Gdańsk sample runs to 24 A4 pages) and a CSV with one row per night: median, middle-half band, hotel and home medians, and how many places were open.
How fresh are the prices?
Each exhibit prints the dates its prices were read. The 180 nights start on the day the report is made.
Is this a subscription?
No. One payment of €49 for one city's report. The files are yours to keep.
Get the report for your city
180 nights · 30 exhibits · PDF + CSV · €49 one-off
Secure card payment by Stripe · emailed within 2 hours, checked by hand